SF Debug Viewer X › Guides › Apex debug log analyzer
Free online Apex debug log analyzer
You don't need to install a desktop log analyzer to make sense of a Salesforce debug log. SF Debug Viewer X is a free, in-browser analyzer that parses a log into a call tree, summarizes it with stats, and lets you filter and search — without uploading anything.
Open SF Debug Viewer X →Analyze a log in 3 steps
- Load the log. Paste it or drop a
.log/.txtfile, then it parses into a call tree. The ▶ Load sample button shows an example instantly. - Size it up with the stats bar. See methods, SOQL, DML, exceptions, line count and execution duration at a glance before you dig in.
- Investigate. Filter by event type, hide noise, add highlights, and use global search — across multiple log tabs if you're comparing runs.
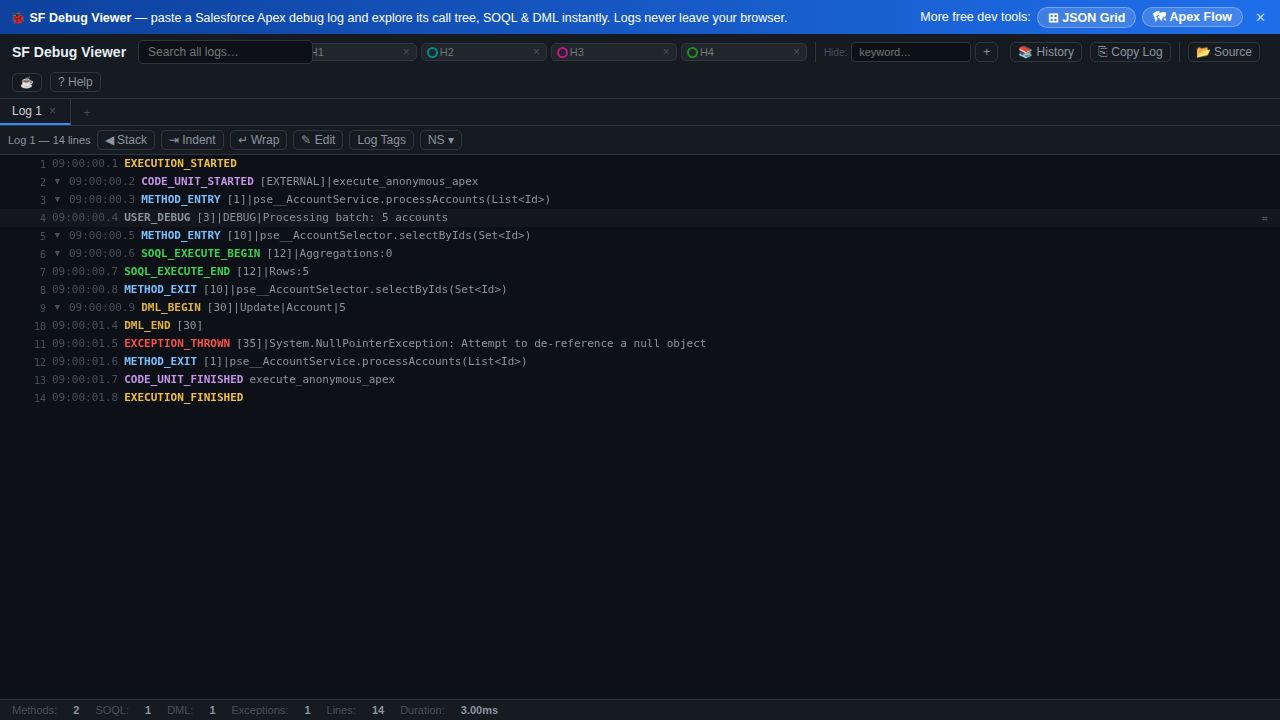
What the analyzer gives you
- Stats bar — methods, SOQL, DML, exceptions, line count and duration for the whole run.
- Color-coded call tree of methods, SOQL, DML, callouts, flows, exceptions and assignments.
- Multi-log tabs with global search across them.
- Filters & highlights — type toggles, namespace and log-tag filters, keyword hide, and up to four highlight slots.
- History auto-saved locally, and everything parsed in the browser — nothing uploaded.
Because it runs client-side, it's safe for production logs: nothing is sent to a server, and your local history persists between visits.
Frequently asked questions
- Is there a free online Apex debug log analyzer?
- Yes — SF Debug Viewer X. Paste a log and it parses it into a color-coded call tree with a stats bar, type filters, multi-log tabs and search. No signup, nothing uploaded.
- Can I analyze more than one debug log at a time?
- Yes. Multiple log tabs are supported with global search across them, so you can compare runs or keep several logs open at once.
- What statistics does it show for a log?
- A stats bar with the number of methods, SOQL queries, DML statements, exceptions, total line count and execution duration.