SF Debug Viewer X › Guides › Read a Salesforce debug log
How to read a Salesforce Apex debug log
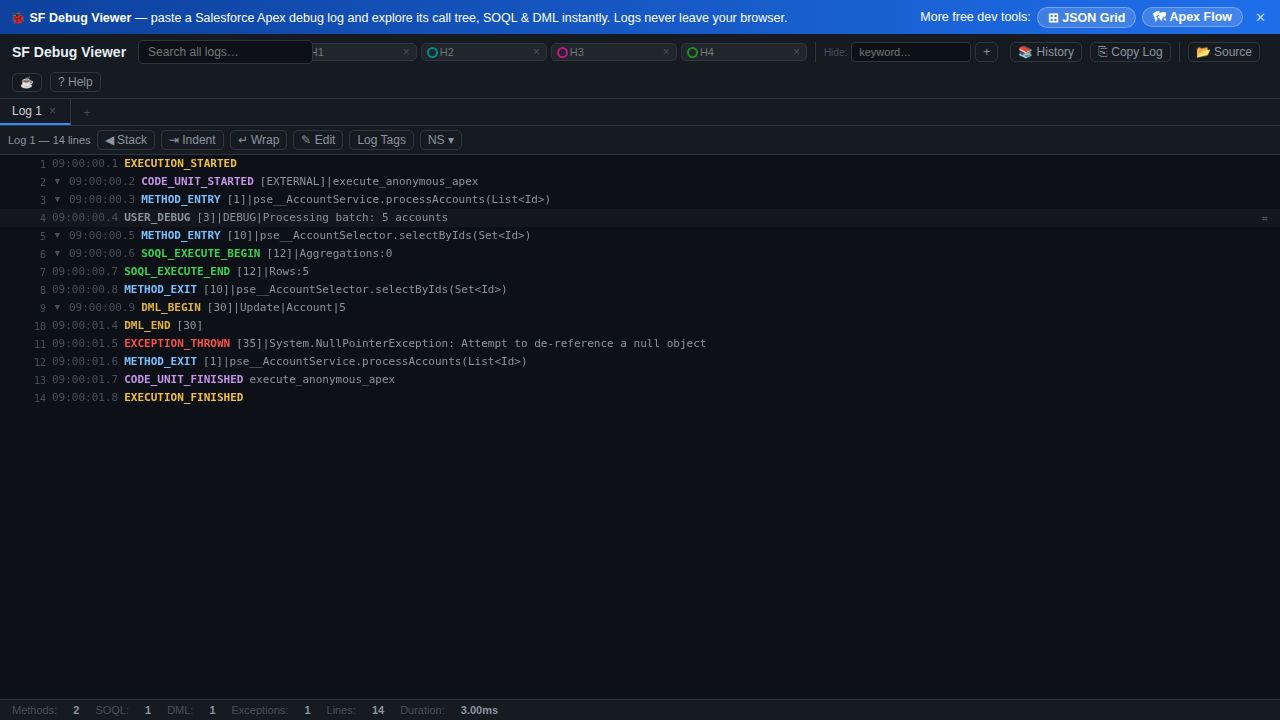
A raw Apex debug log is thousands of timestamped lines — almost impossible to follow by scrolling. The trick is to turn it into a call tree: a nested, color-coded view of what executed, in order. Here's how to read one fast.
Open SF Debug Viewer X →Read the log in 3 steps
- Paste or drop the log. Open SF Debug Viewer X and paste the log text, or drag in a
.log/.txtfile. Click ▶ Load sample to try it on an example first. - Read the call tree. The log is parsed into a nested tree of methods, constructors, SOQL, DML, callouts, flows, exceptions and variable assignments — color-coded by type so execution reads top to bottom.
- Navigate and filter. Click a tree node to jump to its raw log line (and back), toggle event types on and off, hide noise like system methods, and search across the log.
What makes a log readable
- Call tree, not raw text — nesting shows what called what, in order.
- Synced raw view — jump between the tree and the exact log line either way.
- Type filters & toggles — show only User Debug, hide system methods, variable assignments, or timing gaps.
- Namespace, log-tag and keyword filters, plus up to four highlight slots to spotlight what matters.
- Private — the log is parsed in your browser and never uploaded.
Start broad, then narrow: read the tree top-down to find the area of interest, then turn on filters and highlights to isolate it. Use the synced raw view to confirm the exact line.
Frequently asked questions
- How do I read a Salesforce Apex debug log?
- Paste or drop it into SF Debug Viewer X; it parses the raw lines into a color-coded call tree of methods, SOQL, DML, callouts, flows and exceptions. Click a node to jump to its raw line, filter by type, and search — all in the browser.
- What do the events in an Apex debug log mean?
- The log records execution events — method/constructor entry and exit, SOQL, DML, callouts, flow steps, variable assignments and exceptions. They're grouped into a nested call tree and color-coded by type so you can follow execution in order.
- Is the debug log uploaded to a server?
- No — it's parsed entirely in your browser, so even logs with sensitive data never leave your machine.