SF Debug Viewer X › Guides › Find SOQL & limit hotspots
Find SOQL, DML & governor-limit hotspots in a debug log
"Too many SOQL queries: 101" almost always means a query is running inside a loop. A debug log holds the answer — you just need to surface the counts and see which method is firing the queries. Here's how to find the hotspot.
Open SF Debug Viewer X →Track down the hotspot in 3 steps
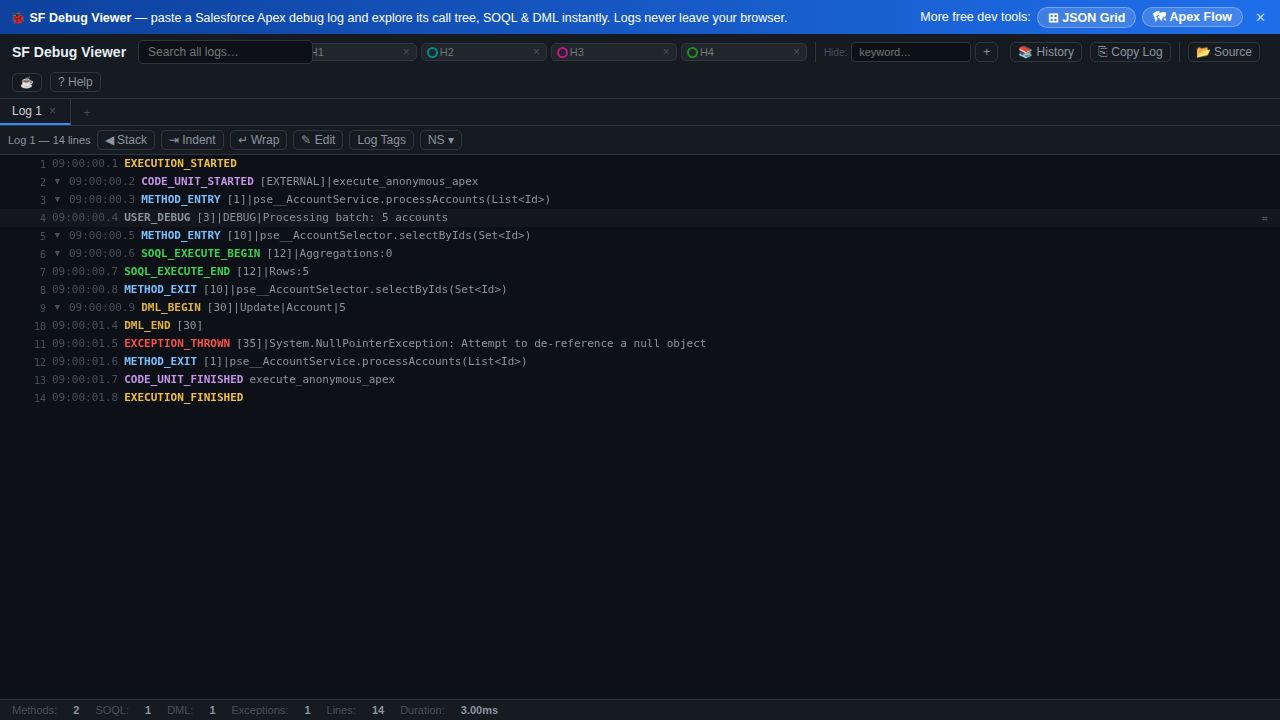
- Check the stats bar first. Load the log and read the totals — SOQL, DML, methods, exceptions, line count and duration — to confirm how close you are to a limit.
- Filter to SOQL (or DML). Turn off the other event types so the tree shows only queries, in execution order, with the method that issued each one.
- Look for repetition. The same query repeated many times under one method is the classic loop-query pattern. Use search and highlights to pin the offending call, then jump to the raw line to confirm.
Why this works
- Counts up front — the stats bar tells you the SOQL/DML totals before you read a single line.
- Type filters isolate the signal — view only SOQL or DML to see exactly where they happen.
- Timing-gap toggle & duration help you spot slow stretches, not just query counts.
- Highlights & search pin a recurring query or method across a long log.
Honest scope: SF Debug Viewer X surfaces the counts, ordering and the method behind each event so you can locate the hotspot fast — fixing it (bulkifying the query, moving it out of the loop) is still a code change on your side.
Frequently asked questions
- How do I find which SOQL queries caused a governor-limit error?
- Read the SOQL/DML counts in the stats bar, then filter the call tree to SOQL events to see each query in order and the method that issued it. The same query repeated under one method is the usual cause of "Too many SOQL queries: 101".
- Can the viewer show how many SOQL and DML statements ran?
- Yes — the stats bar reports totals for methods, SOQL, DML and exceptions for the whole run.
- How do I spot a slow method in the log?
- Use the execution duration plus the timing-gap toggle and the call tree, and filter out noise like system methods and variable assignments so the expensive calls stand out.